
Statistics
Track DNS usage and quality per customer, cluster or node.
Who can: anyone with Ver (View) on DNS Recursivo.
Step by step
Section titled “Step by step”-
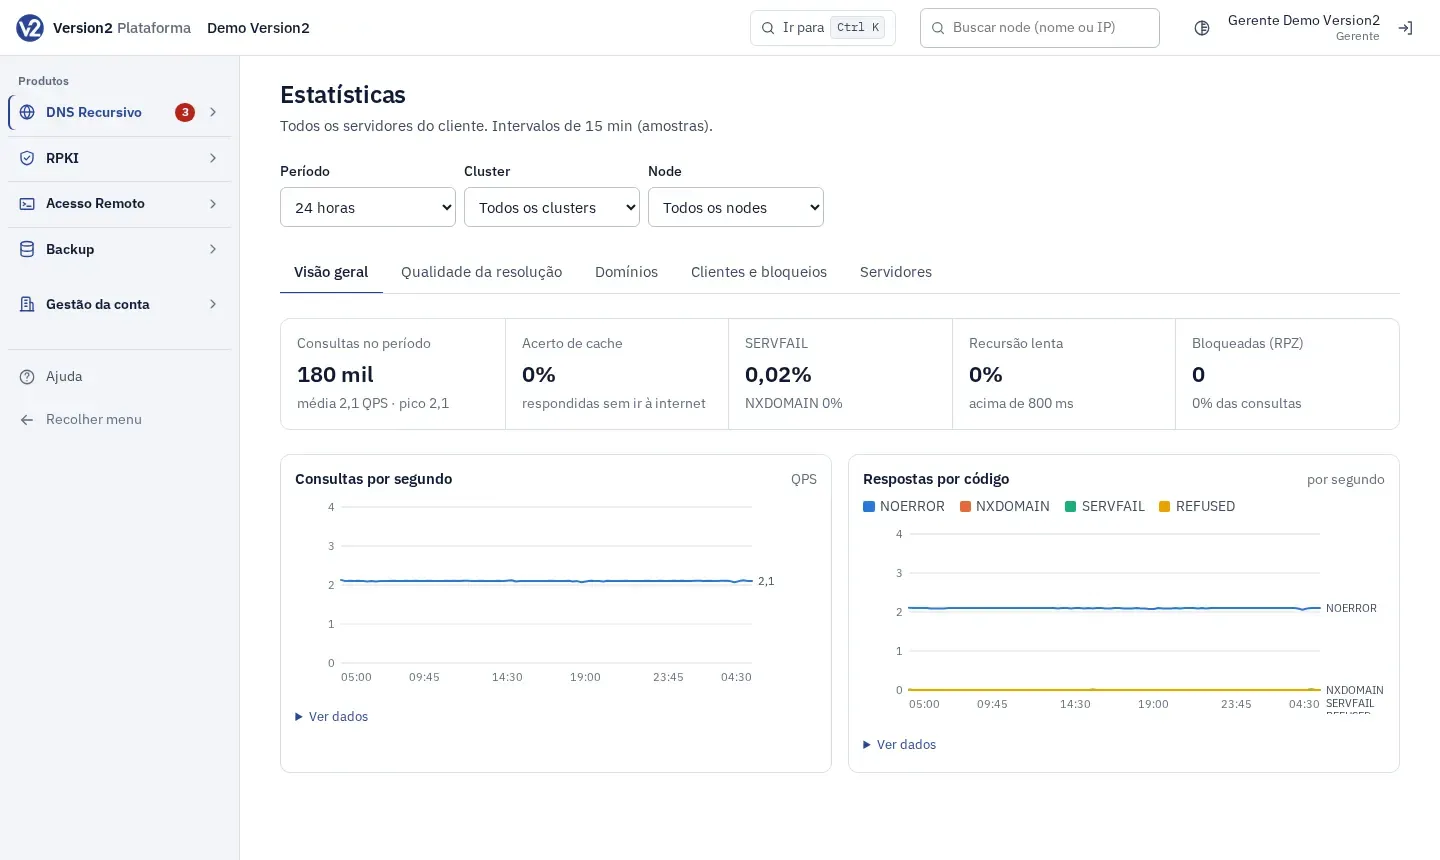
In the menu, open Operação (Operations) > Estatísticas (Statistics). The statistics icon in the node list opens that node directly.
-
Choose the Período (Period: 1 hour, 6 hours, 24 hours, 7 days, 30 days or 90 days), the Cluster and the Node.
-
Use the tabs:
- Visão geral (Overview): Consultas no período (Queries in period), Acerto de cache (Cache hit), SERVFAIL, Recursão lenta (Slow recursion), Bloqueadas (RPZ) (Blocked), and the charts of queries and of responses by code.
- Qualidade da resolução (Resolution quality): cache hit, SERVFAIL over queries, recursion time and query types.
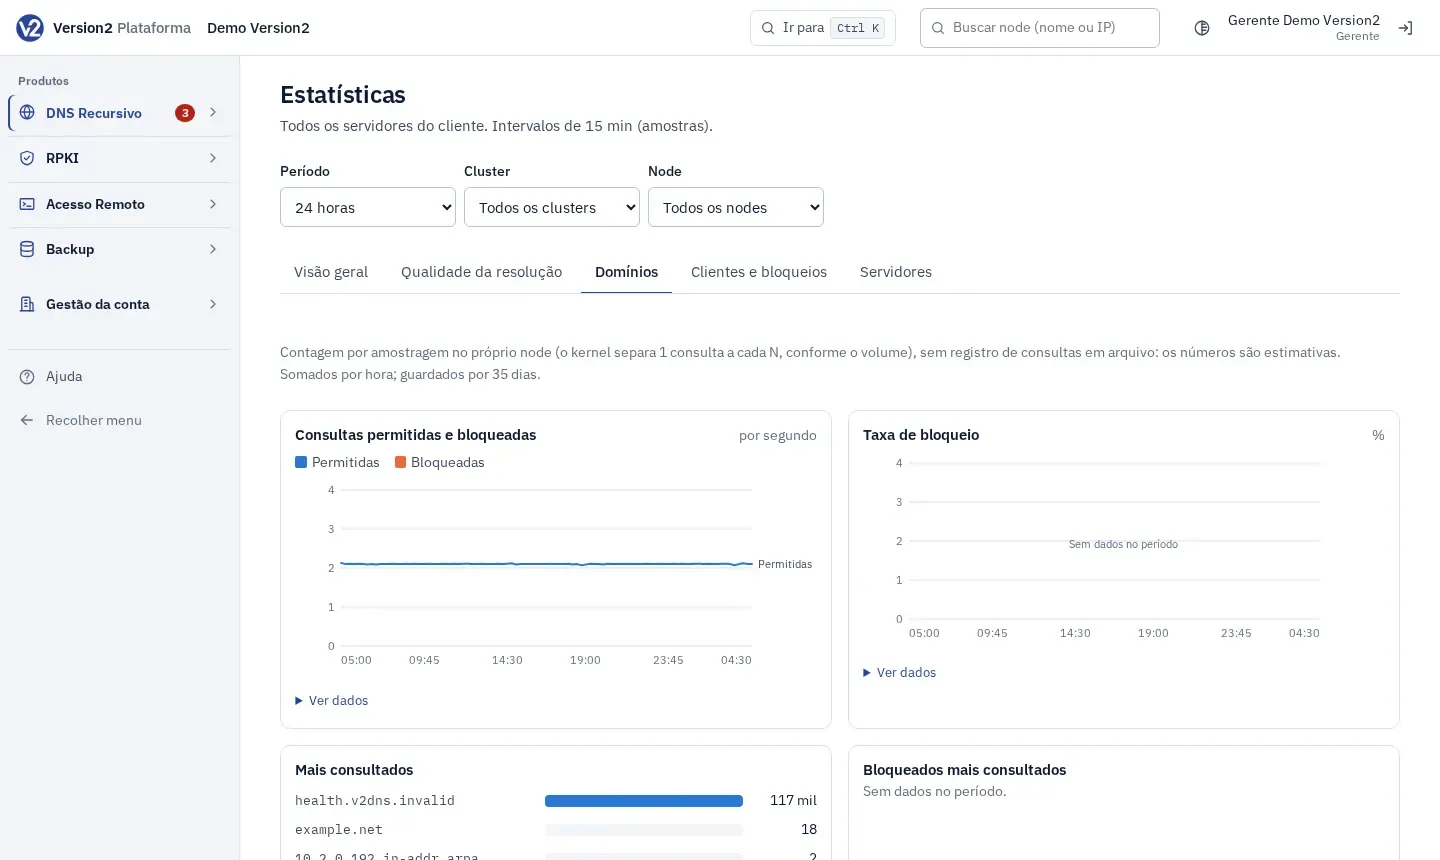
- Domínios (Domains): allowed and blocked queries, block rate, Mais consultados (Most queried) and Bloqueados mais consultados (Most queried blocked).
- Clientes e bloqueios (Clients and blocks): IPs que mais consultam (Top querying IPs), Recusados pelo BIND (REFUSED) (Refused by BIND) and Barrados no firewall (nftables) (Dropped at the firewall).
- Servidores (Servers): recursive clients, CPU, memory, network traffic and the Por node (Per node) table.
Expected result
Section titled “Expected result”The charts use samples every ~30 s for 7 days and hourly summaries for 400 days. Top domains are summed per hour and kept for 35 days. With 1 hour and 6 hours, the screen refreshes every minute. Under heavy traffic, counting is done by sampling and the numbers are estimates.
If something goes wrong
Section titled “If something goes wrong”- The top domains list is empty. The screen shows the reason per node:
- old agent: run the install command again;
- query logging off: turn on Registrar consultas para o top de domínios (Log queries for the top domains) on the cluster’s Configuração (Configuration) tab;
- BIND not writing the log: reapply the configuration on the node;
- node not communicating: check the server’s outbound internet access.